
Challenges in practice
In your daily work, enormous amounts of data are generated – in goods receipt, production, complaints, inspections, and supplier evaluations. At the same time, key performance indicators (KPIs) reside in the ERP system, and quality data in the CAQ system.
The reality:
Reports are exported, manually compiled, or recreated in Excel. Differing data sets lead to discussions instead of decisions. Trends are often only recognized after deviations have already incurred costs.
What's missing is a consistent, cross-module, and cross-system view of your data – without media breaks, duplicate data maintenance, and time-consuming custom analyses.
This is precisely where integrated business intelligence comes in: It combines quality and ERP data in a shared database and creates the foundation for well-founded, fast, and fact-based decisions for the entire quality management process.
Solution QS1
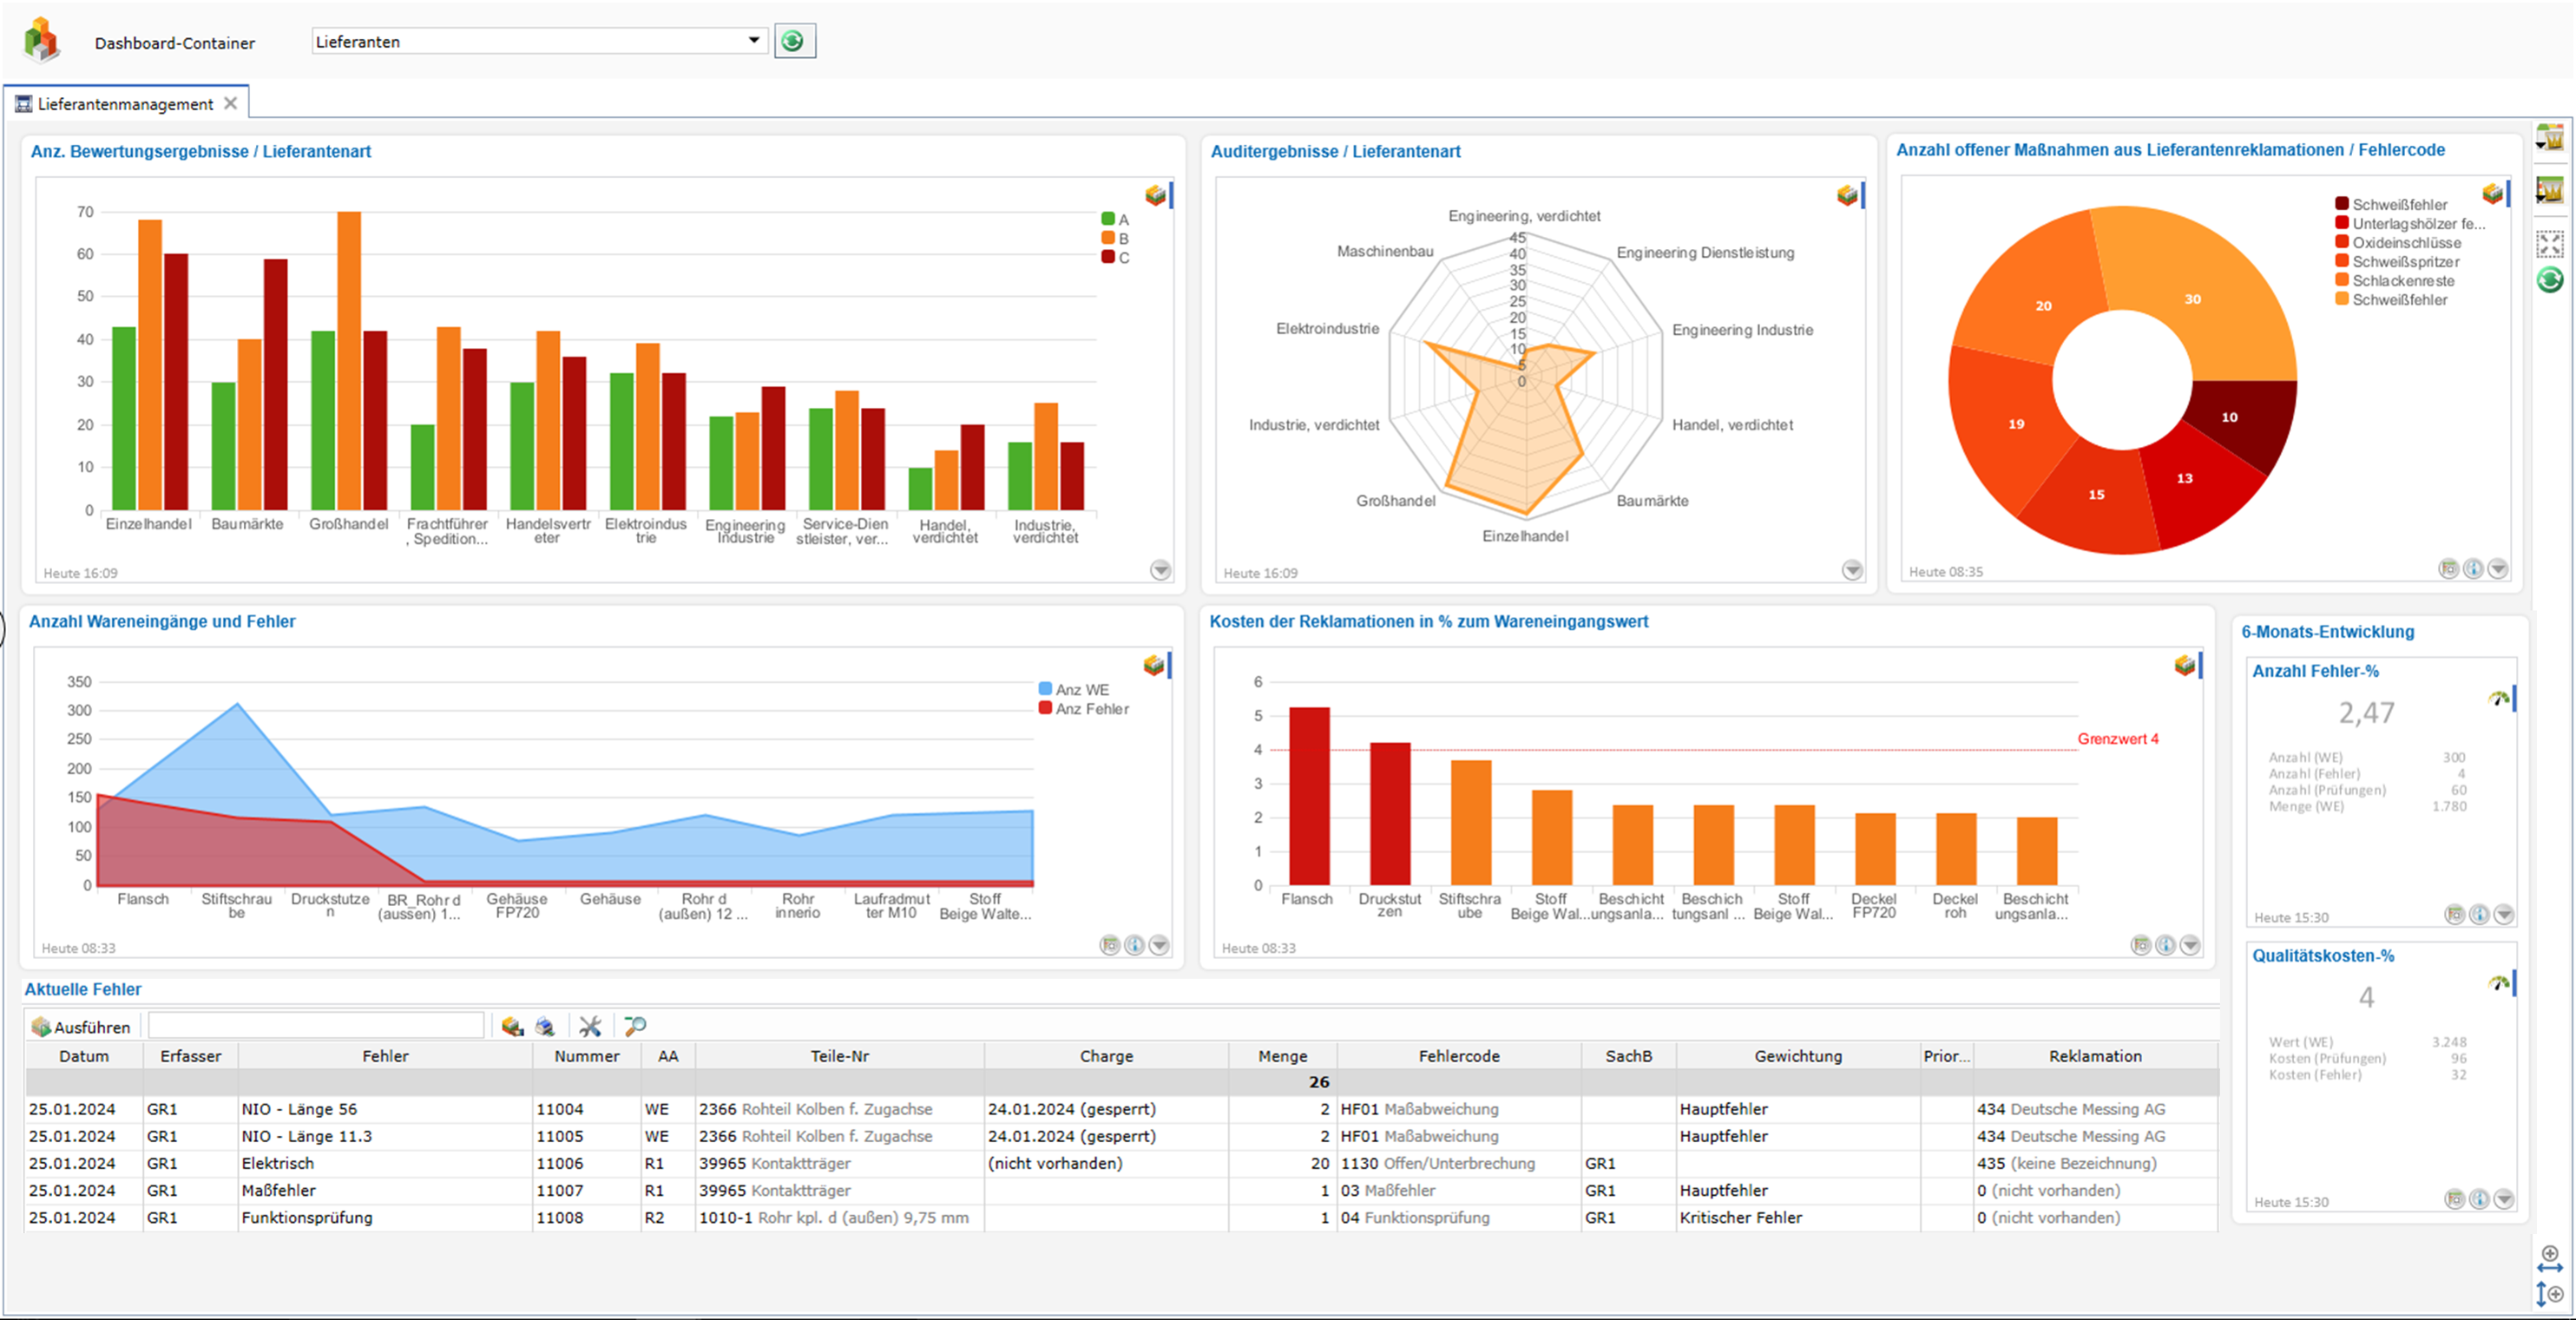
With QS1, the Quality BI, you gain a comprehensive, cross-module reporting solution for all your quality assurance (QA) and quality management (QM) data. Whether it's goods receipt, production inspection, complaints, corrective action management, or supplier evaluation – all quality information is available in a single, consistent database.
This means that key performance indicators (KPIs) are not generated in isolation for each module, but rather within the overall context of your quality processes. Interactions, trends, and structural weaknesses become transparent – across departments and process boundaries.
By connecting to your ERP master data – such as part, supplier, customer, or order – reports remain clearly referenced and practical. Quality KPIs are therefore always reflected in the real-world business context, eliminating the need for duplicate master data maintenance.
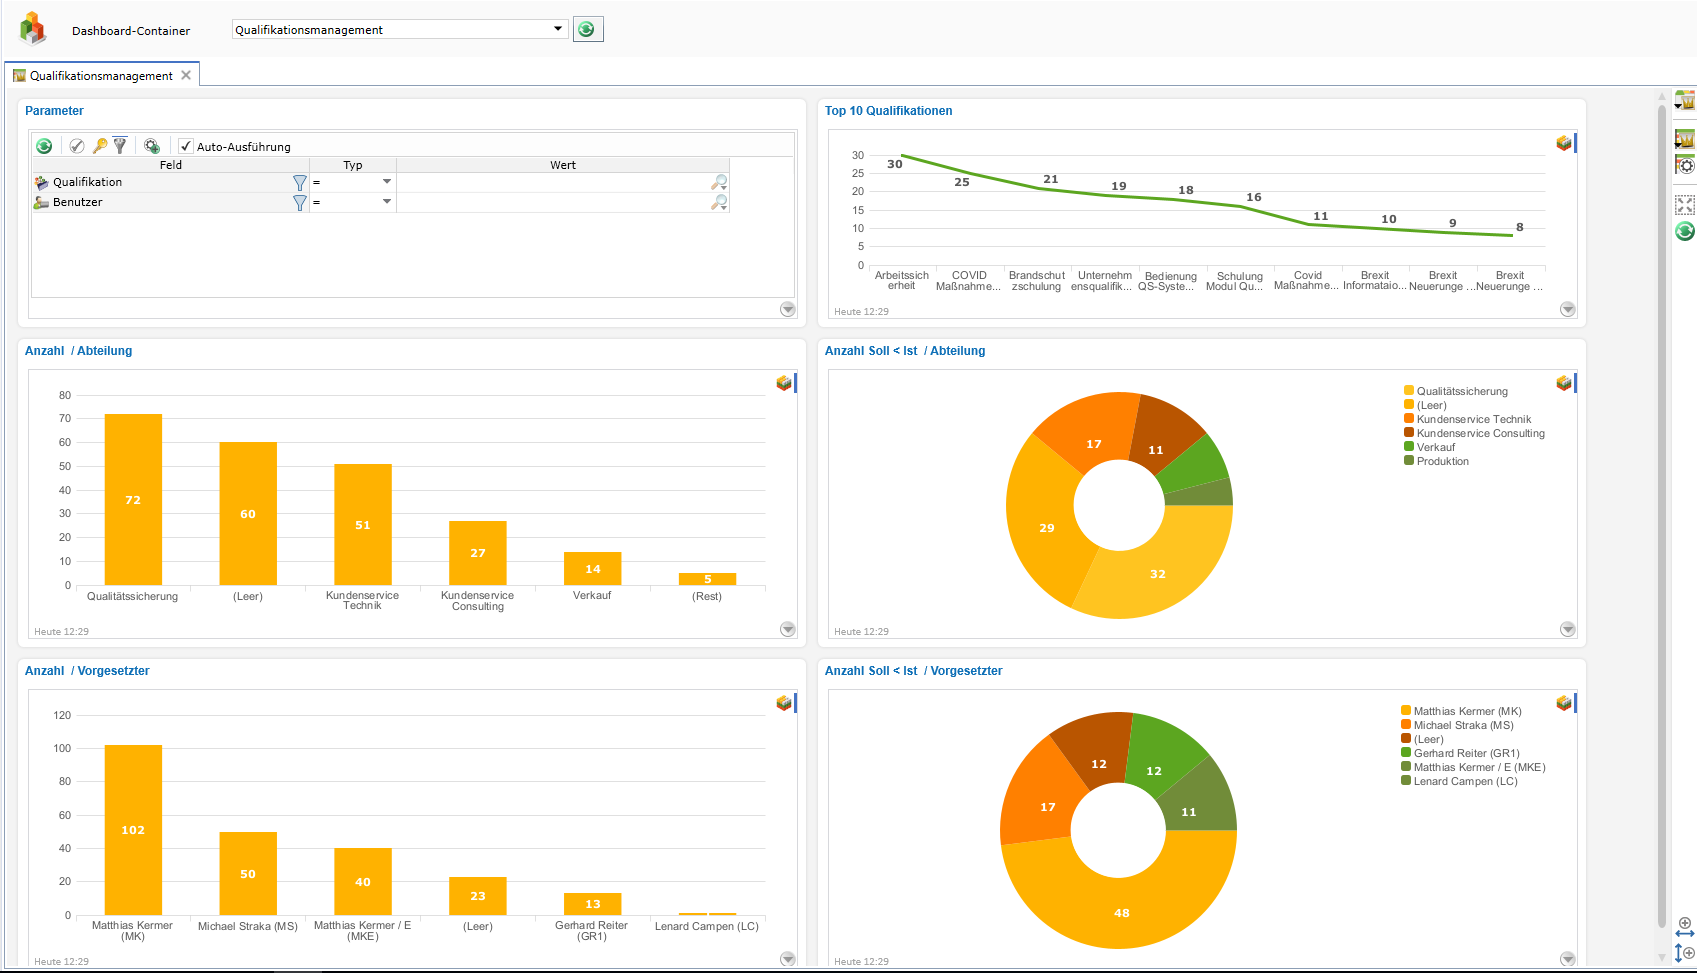
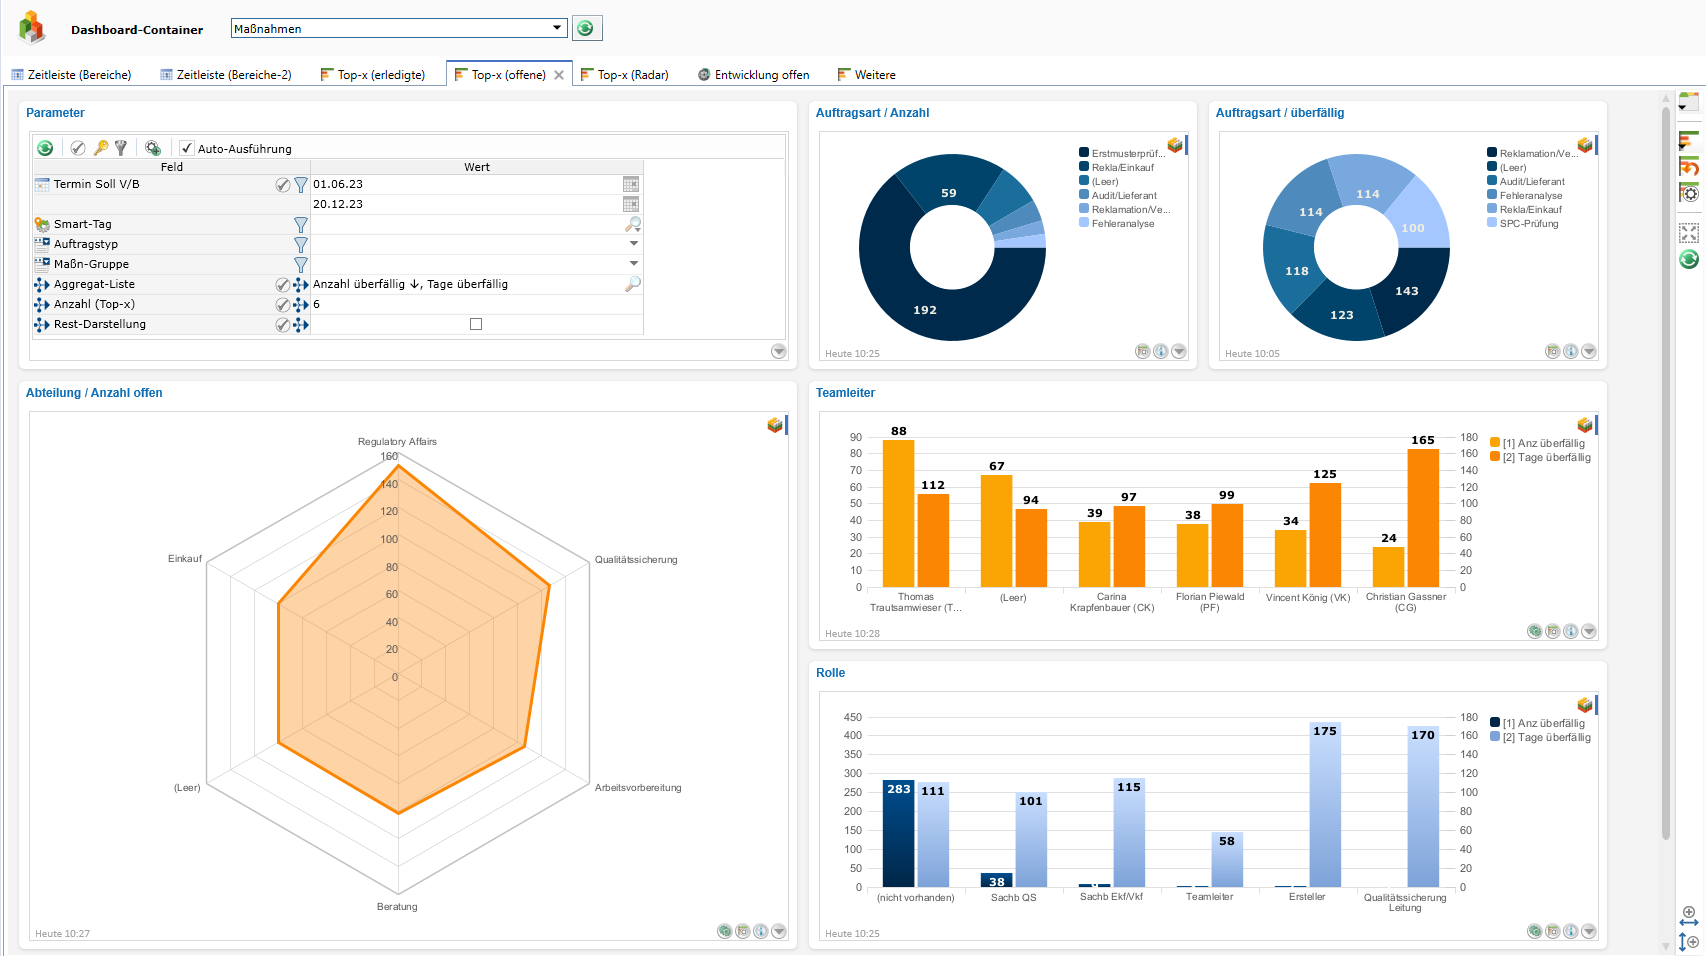
QS1 Quality BI serves as the central analysis and control tool for your quality management. Interactive dashboards with freely definable filters, groupings, and drill-down functions enable customized analyses across all QS1 objects. Alternatively, ready-to-use best-practice templates are available.
This transforms distributed quality data into an integrated decision-making foundation – transparent, flexible, and usable company-wide.
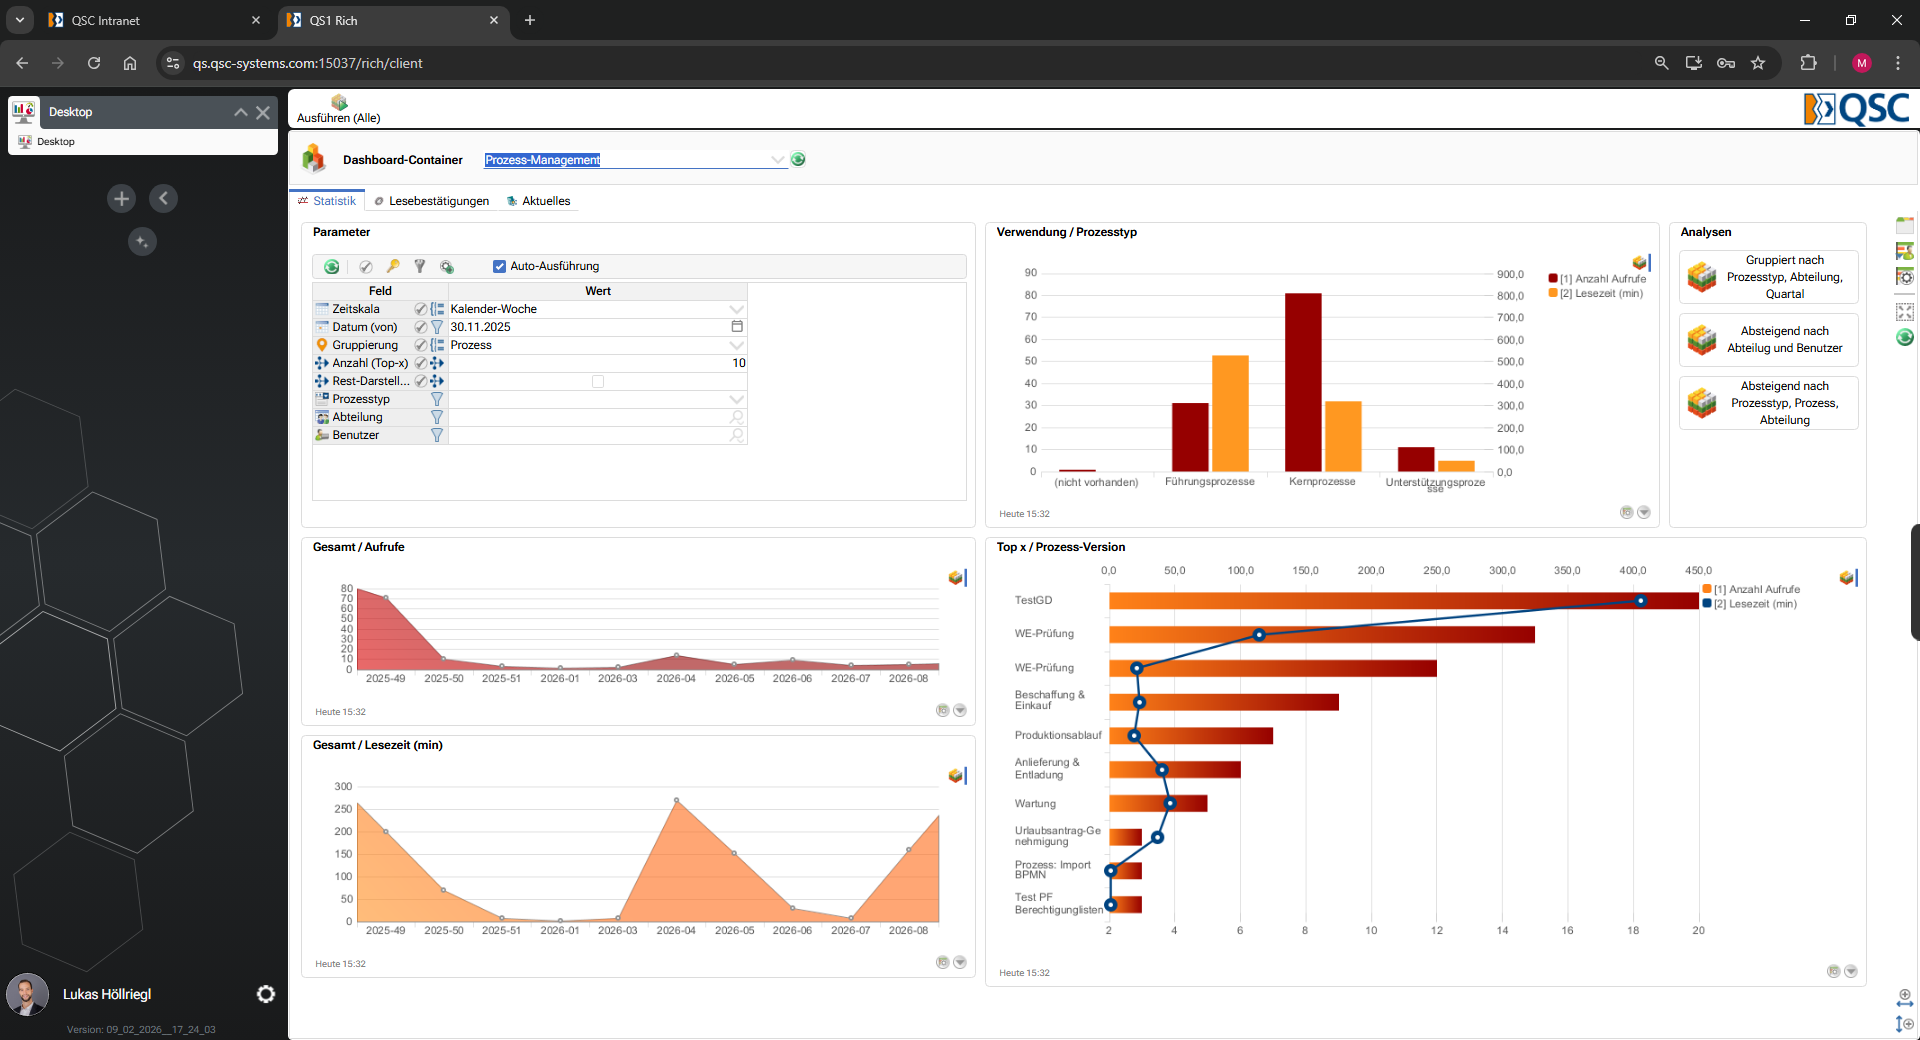
- Interactive dashboards: Individual filtering, display, and grouping options for maximum flexibility
- Standard templates: Ready-to-use dashboards for key QA/QM KPIs
- Automated reporting: PDF reports at the touch of a button for management and departments
- Custom layouts: Freely combinable KPIs, charts, tables, and traffic light indicators
- Real-time monitoring: Warning mechanisms and automatic recalculation when data changes
- Pivot analyses: Dynamic evaluations for multidimensional perspectives
- Self-service configuration: Customizations and extensions directly by the user
- Cross-module database: Access to all QA1 data in a consistent context
- ERP referencing: Evaluations based on partial, supplier, customer, or order data
- Aggregated KPIs: Prepared statistical and condensed data for fast performance
- Authorization control: Role- and value-area-based access control
- Drill-down function: Navigation from the management overview to To the raw data level
- Context navigation: Direct switching from charts to related documents or programs
- Export options: Comprehensive reporting functions including Excel export
Does this sound familiar?
- Quality data resides in the CAQ system, business KPIs in the ERP system, and to provide a management response, you have to gather data from multiple systems and manually consolidate it.
- Analyses are exported and recreated in Excel, with differing data versions triggering discussions instead of facilitating decisions.
- Trends and structural weaknesses become apparent too late because analyses are conducted periodically and retrospectively, while the costs are already being incurred.
- KPIs are generated in isolation for each department or module, so interactions between goods receipt, production, complaints, corrective actions, and supplier performance remain untraceable.
- Ad-hoc inquiries are expensive: Special analyses tie up resources, take too long, and ultimately, the insights are not available as reusable reports.
This should be achieved through a robust process
- A consistent, cross-module database: Quality data must be systematically consolidated to generate key performance indicators (KPIs) within the overall context of all quality assurance (QA) processes.
- Unambiguous referencing via ERP master data: Part, supplier, customer, order, and other ERP objects must be available as context without duplicating master data.
- Interactive analysis with drill-down functionality: It must be possible to navigate from the management overview down to the raw data level so that root causes can be quickly verified.
- Automated reporting and monitoring: Standard reports must be reproducibly available, and alert mechanisms must provide early notification of deviations.
- Role-based view: Dashboards must function according to responsibilities, with clearly controlled access and value ranges.
Coverage in QS1
- QS1 Quality BI offers a comprehensive, cross-module reporting solution that integrates data such as goods receipt, production inspection, complaints, corrective action management, and supplier evaluation on a single, consistent database.
- It links quality metrics with ERP master data, using parts, suppliers, customers, and orders as references. This ensures that reports remain practical and unambiguous, eliminating the need for duplicate master data maintenance.
- It enables interactive dashboards with freely definable filters, groupings, and drill-down functions, allowing direct navigation from the metric level down to the raw data level and into related documents or programs.
- It provides ready-to-use best-practice templates and supports self-service configuration, allowing users to customize and extend dashboards and reports without having to request custom reports each time.
- Supports automated reporting by generating and distributing PDF reports at the touch of a button, and also offers export options, such as to Excel, when needed.
- Enables real-time monitoring with alert mechanisms and automatic recalculation when data changes, while aggregated key performance indicators (KPIs) and predefined summaries ensure performance.
- Controls access via role-based and value-based permissions, so that management, quality assurance, purchasing, and production each have the appropriate view.
Your Result: A robust, cross-module view of quality and ERP context, less Excel replication and shadow lists, faster root cause analysis through drill-down, earlier trend and deviation detection, reproducible reports for all hierarchy levels, and fact-based control of measures and improvements.
Your Advantages
- Transparency: Cross-module QA/QM KPIs available at any time – exactly where you need them.
- Availability: Dashboards and Balanced Scorecards accessible at your workstation, on the intranet, or via mobile devices.
- Up-to-dateness: Automatic recalculation and publication of your standard analyses without manual effort.
- Ad-hoc analysis: Spontaneous evaluations directly from the process or object context.
- Seamless integration: Navigation from the KPI to the specific data record or document – without any media breaks.
- Responsiveness: Early detection of trends and deviations for proactive action.
- Process focus: KPI-based support for your action management.
- Efficiency: Fewer manual evaluations, no shadow lists, clear decision-making criteria.
- Acceptance: Uniform, representative reports at industry-standard level for all hierarchical levels.
- Flexibility: Transparency precisely to the extent required by roles and responsibilities.
