
Challenges in practice
In daily practice, companies face the challenge of reliably evaluating large volumes of testing and process data, identifying deviations early on, and simultaneously maintaining standards-compliant documentation. Data is often scattered across various systems, statistical analyses must be initiated manually, and critical trends are only recognized after scrap has already occurred.
Furthermore, evaluating capability indices, control charts, or long-term trends requires a high degree of transparency and expertise. Without an integrated solution, a comprehensive view of processes—from incoming goods inspection through production to outgoing goods—is often lacking. This not only hinders rapid decision-making but also prevents truly proactive process control.
Solution QS1
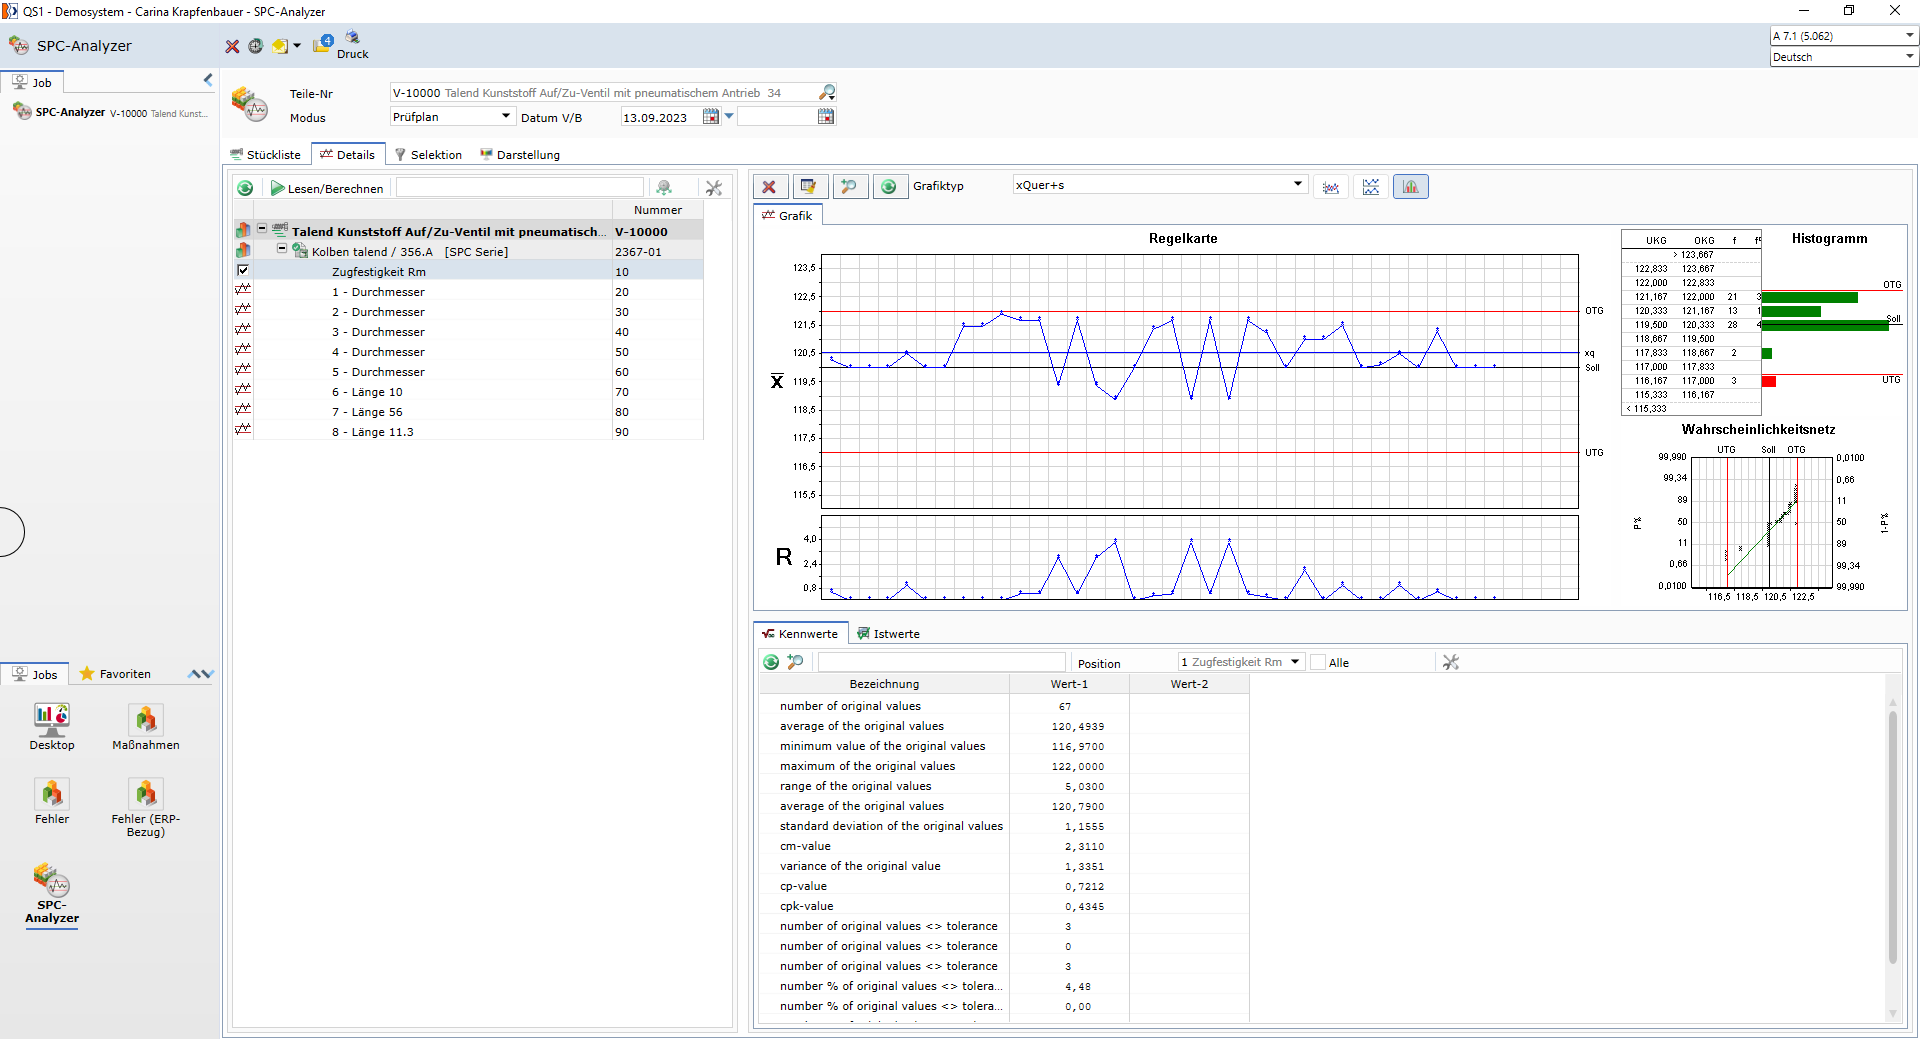
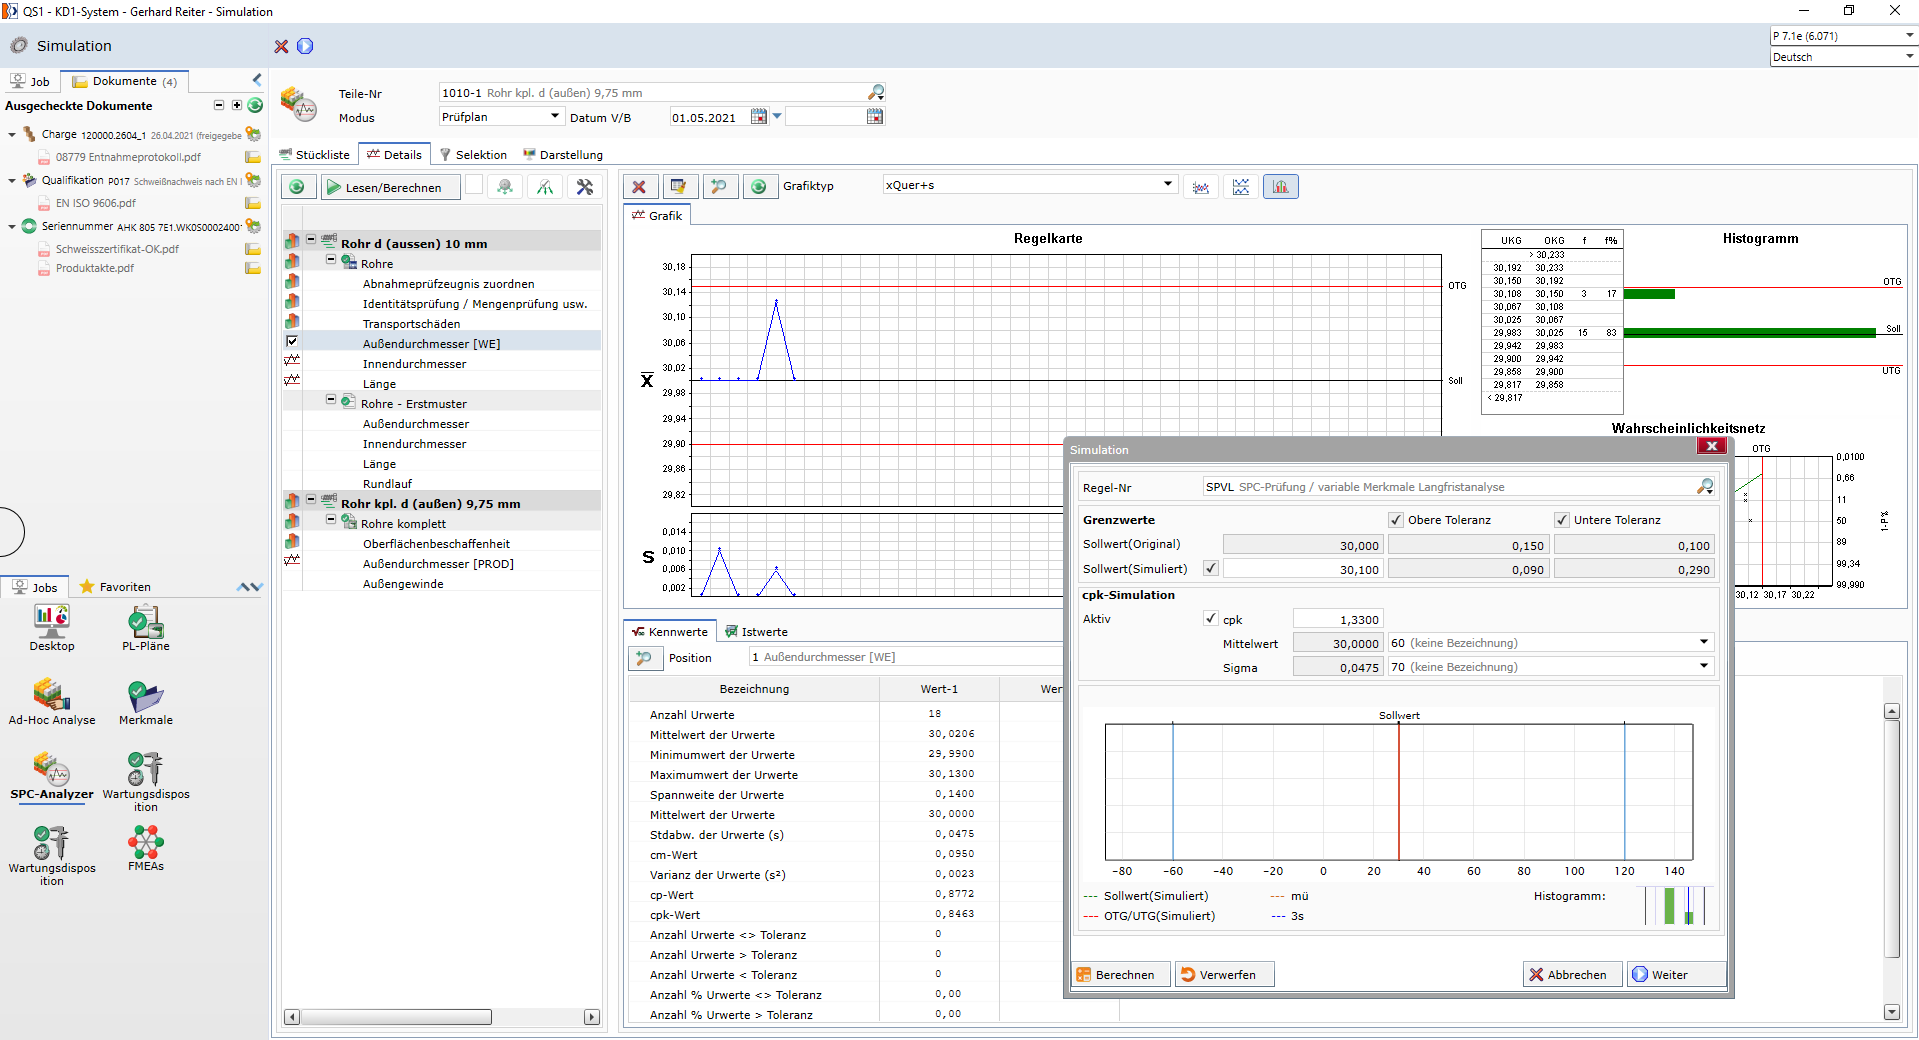
The QS1 SPC Analyzer module provides you with a powerful, universal tool for professional statistical process control. The software enables you to centrally evaluate quality and inspection data and analyze it in a targeted manner based on defined entry points—from classic control charts to machine and process capability studies, all the way to complex long-term analyses. All common statistical distributions are supported, and relevant key metrics are calculated automatically. Customizable SPC rules at the attribute level ensure that your company-specific requirements are precisely met.
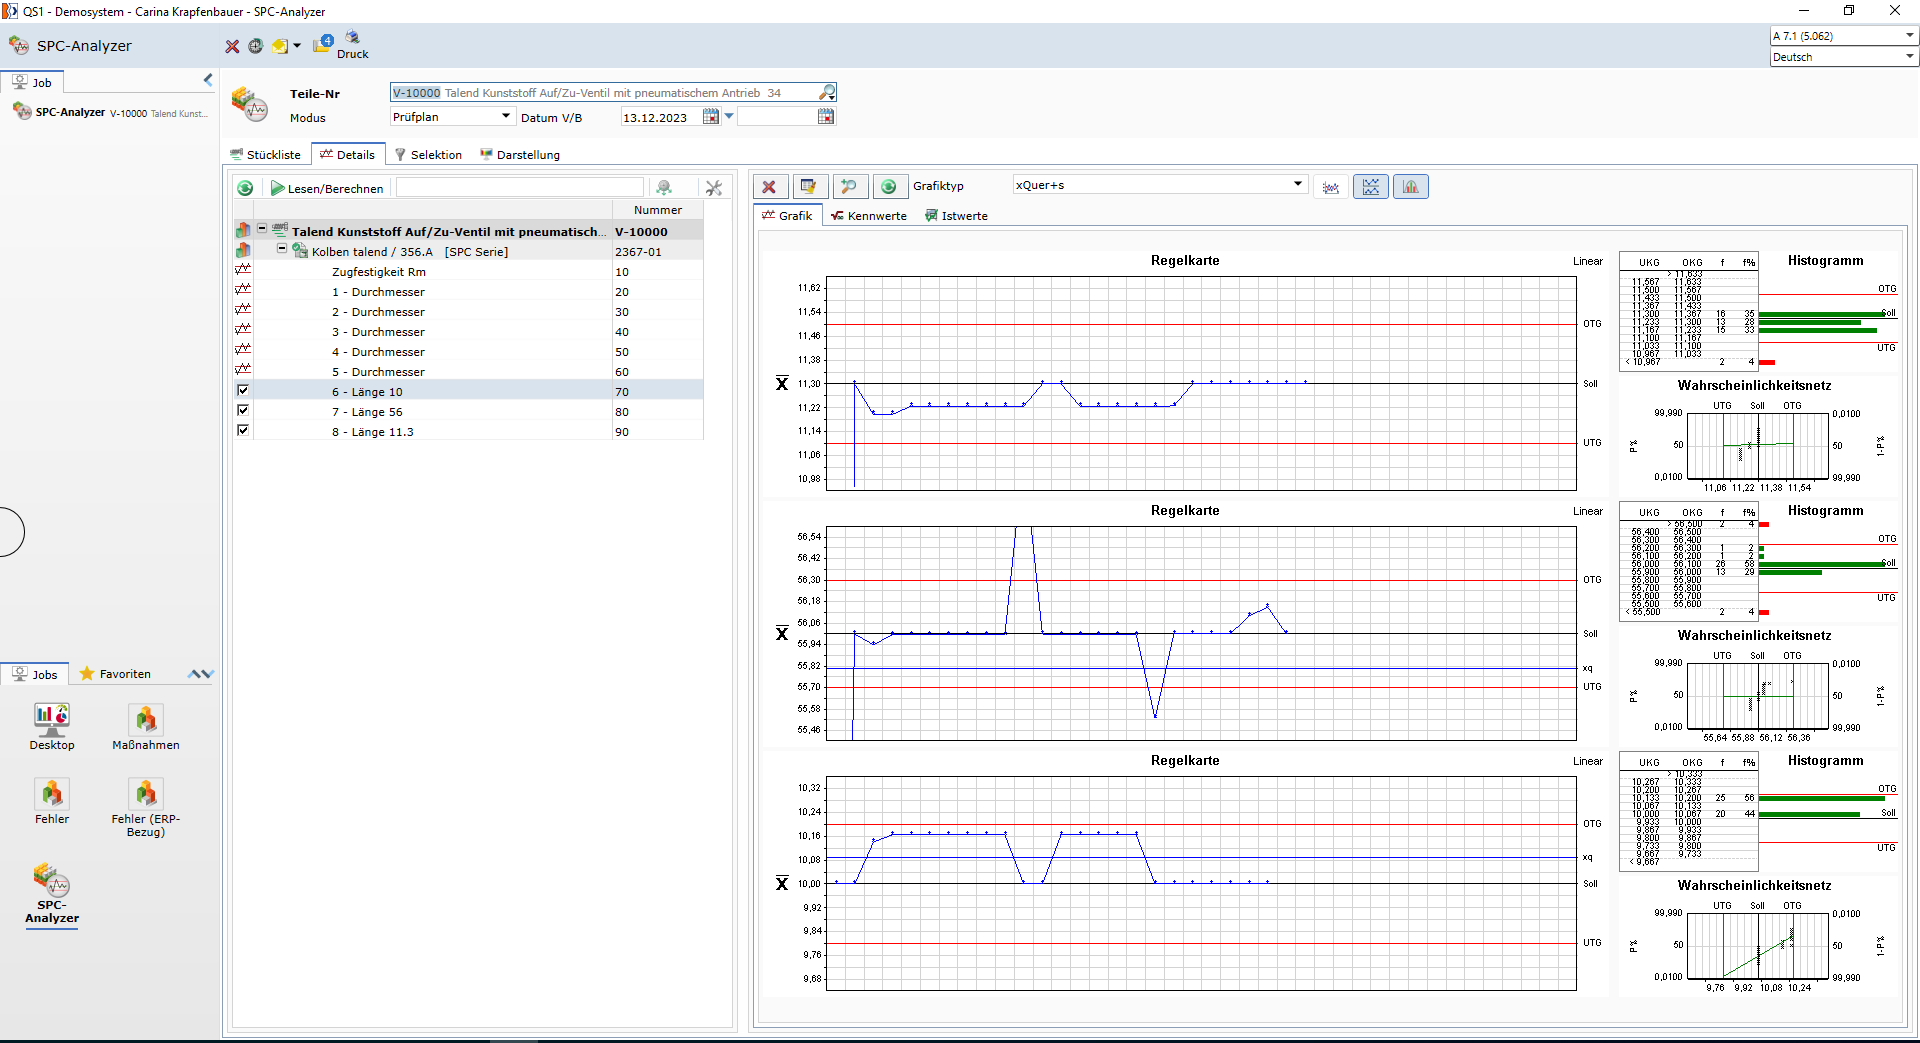
Modern visualization techniques such as histograms, control charts, and network analyses provide maximum transparency, while QS1 detects deviations in real time and initiates defined workflows. This transforms simple data collection into active, predictive process control—integrated, compliant with standards, and traceable at all times.
- Individual rule sets: Flexibly definable SPC rules at the feature level for maximum adaptability to your processes.
- Statistical diversity: Support for all common statistical distributions for standards-compliant and well-founded analyses.
- Automatic key performance indicators: Fully automatic calculation of capability and performance indicators for immediately reliable results.
- Capability analyses: Comprehensive machine and process capability studies for reliable process evaluation.
- Formula editor: Integrated option for individually defining your own calculations and evaluations.
- Modern visualization: Meaningful control charts, histograms, and network analyses for maximum transparency.
- Multi-level analyses: Trend and structure analyses down to the cavity or batch level for in-depth insights.
- Statistics monitor: Intelligent real-time monitoring with configurable workflows for immediate response to deviations.
Does this sound familiar?
- Large quantities of testing and process data are generated, but the analysis process is not reliably streamlined: data is scattered, analyses are initiated manually, and trends only become visible after scrap has already been produced.
- Control charts and capability indices exist, but are not established as control instruments: Cp/Cpk, etc., are calculated retrospectively instead of acting as an early warning system within the process.
- Deviations are detected too late or not addressed consistently: a clear control and response logic is lacking that automatically translates rule violations into corrective actions and assigns responsibilities.
- Long-term trends are opaque: drift, shift/machine effects, cavity or batch variations remain hidden because the data structure and analysis options are not consistent.
- Standards-compliant documentation is disproportionately time-consuming: audits require reliable, verifiable statistics. Without an integrated system, this becomes a task requiring expert analysis and Excel spreadsheets.
This should be achieved through a robust process
- Central, consistent database: Inspection data from goods receipt, production, and goods issue must be analyzable in a single system without media breaks or manual merging.
- Automated calculation of relevant key performance indicators (KPIs): Capability and performance indicators must be calculated in a compliant and reproducible manner, including transparent assumptions and parameters.
- Company-specific SPC rule sets: Rules must be definable at the characteristic level (e.g., per part, line, characteristic) so that SPC aligns with the actual process logic.
- Real-time monitoring with a response mechanism: Rule violations must be detected so that workflows, tasks, or actions are automatically generated.
- Multi-level analyses: Evaluations must be resolvable down to the batch, serial number, or cavity level while simultaneously enabling long-term analyses.
Coverage in QS1
- The SPC Analyzer provides a universal tool for professional statistical process control, centrally evaluating quality and inspection data along defined entry points (from control charts to capability and long-term analyses).
- Supports all common statistical distributions and calculates relevant key performance indicators (KPIs) fully automatically, ensuring standards-compliant, reproducible, and quickly available evaluations.
- Enables individually definable SPC rules at the feature level, precisely mapping company-specific requirements.
- Provides modern visualizations (control charts, histograms, network diagrams) and supports trend and structure analyses down to the cavity, batch, or series level.
- Detects deviations in real time via a statistics monitor and initiates configurable workflows, transforming statistical signals into concrete actions and process improvements.
- Enables end-to-end analyses across all quality processes (especially in combination with production inspection and incoming goods inspection), providing a consistent view of process states, trends, and risks.
Your result: Early detection of drift and rule violations, less scrap through proactive control, reliable and audit-proof statistical evidence without Excel overhead, transparent capability assessment down to detailed structures, and SPC that doesn't report but controls.
Your advantages
- Transparency: Complete overview of process states, trends, and capability indices at all times.
- Early detection: Deviations and rule violations are automatically detected before costly errors occur.
- Standards compliance: Support for common statistical methods and standards-compliant evaluations for reliable audits.
- Flexibility: Individually definable SPC rules, analysis periods, and evaluation structures.
- Efficiency: Automatic calculation of all relevant key performance indicators significantly reduces manual effort.
- Integration: End-to-end analysis across all quality processes – from goods receipt to goods issue.
- Action orientation: Linking statistical results with workflows and measures for genuine process improvement.
